ibaInCycle
|
|
본문Monitoring and analysis of cyclical processes with ibaInCycle
ibaInCycle monitors cyclically recurring and rotating processes online. A precise forecast of quality features is therefore possible already during production. Implementing measures promptly can prevent damage and malfunctions of machines or plants, thereby ensuring the product quality. At a glance Identifying early-stage process changes and anomalies ibaInCycle is an add-on to ibaPDA and monitors all types of cyclically repeating processes, such as recurring processes, but also rotating machine parts, i.e. rollers, gears, etc. ibaInCycle makes it possible to detect anomalies in the process at an early stage, in particular wear on machines and resulting deviations in product quality. This means you are able to take measures promptly to avoid damage and ensure quality.
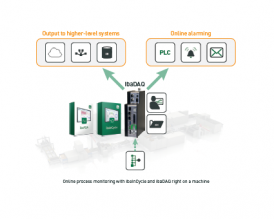
Application examples ibaInCycle is ideal for a number of applications, such as: › Monitoring saw blade wear Application examples It is not only possible to operate ibaInCycle on a central system, but also on the edge device ibaDAQ. This compact monitoring solution can be used right on the machine on site as a standalone solution. Functionality of ibainCycle Process signals from cyclical processes ideally exhibit similar behavior within a cycle. ibaInCycle compares the “learned” good process with the actual process signal and calculates meaningful characteristic values. The user recognizes deviations immediately and can evaluate and response to these accordingly.
Meaningful characteristic values The InCycle Expert module makes it possible to divide process cycles evenly into any number of ranges and freely define meaningful characteristic values for any range:
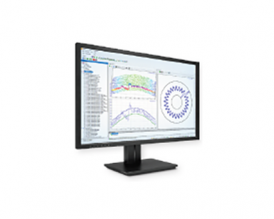
With both versions, central or local system, the analysis and characteristic value calculation occur in ongoing operation. Alarming in real time The characteristic values of any area are monitored for changes. For processes consisting of several steps, the cycles can be divided into several sub-cycles. All characteristic values can be recorded as a signal, visualized and monitored to make sure they do not exceed limit values. The user is automatically alarmed in real time. Output to higher-level systems The characteristic values can be output to higher-level systems, such as databases and cloud systems, for a long term analysis. The measurement files with the raw data can be used for detailed analyses. Demonstrative visualization The cycle view, which was developed specifically for ibaInCycle, offers several demonstrative types of visualization. In the waterfall view, cycle changes over time are displayed particularly clearly. The results of the different areas are displayed graphically and in tabular form. For rotating processes, the circle view offers the ideal way to visualize the process behavior over time to, for example, unambiguously identify the position of a defective tooth in the gear. Monitoring with the Auto-Adapting module After the “good” curves have been learned for different process conditions, deviations are immediately displayed during the process.
Automatically learn process sequence
The adjacent graphic shows the example of a matrix for different process conditions, which take different materials, temperatures and diameters of the product into consideration. |


