본문
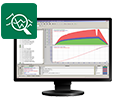
Display of Quality Data - Live and in Color At a glance- Live representation of quality data, measured values, conditions and video sequences
- Software Addon for ibaPDA-V6 and ibaHD-Server
- Scenario Player for video cameras that record using ibaCapture-CAM
- Time and length related display
- Unlimited number of displays
- Offline Trending from dat files and HD data recordings
- Freely configurable visualization objects like e.g.
- Online-FFT analysis
- 2D-colored display for vector signals
ibaQPanel is a software addon that allows for the live display of process and quality data in an HMI-picture. ibaQPanel combines the functionality of technological representations of measurement variables with elements typical for HMI screens. It is seamlessly integrated in ibaPDA-V6. Online FFT-analyses, flatness or temperature profiles as well as alpha numerical and condition-dependent information can be displayed with ibaQPanel in real time. Signal charts can be displayed both time or length related. Thus, measured values which are relevant for long or flat products' quality may be displayed in relation to the length segment. Also, access to historical data of an ibaHD-Server is possible. By means of multidimensional signals (vector signals) and the 2D-colored display, temperature, flatness and thickness profiles can be configured easily. From this display, the product quality is obvious at first sight. The operating personnel thus have the option to see immediately technological relations and influences of the process parameters on quality and hence take corrective actions on the process. Video sequences that have been recorded using ibaCapture-CAM offer live insights in areas of special interest. In case of failure situations, the integrated Scenario Player switches trigger controlled to the according video display. As ibaQPanel is integrated seamlessly in the ibaPDA client software, the whole package of functions and the complete connectivity of ibaPDAV6 are available. All signals that are acquired by the ibaPDA-V6 system, can also be displayed by ibaQPanel. The same applies to the ibaHDServer. The panes for display, the socalled panels, are designed as dockable windows and can be arranged on the screen like usual signal monitors or like tab cards one behind another. For visualization purposes on control desks, the display can be switched to full screen mode for using the entire screen area. Using background graphics, even HMI-like displays can be realized. More display objects are constantly added. Besides the general display properties some objects have special technological functions. For example, multiple coefficients can be used in a cross profile display for a polynomial computation of the profile shape or a measured length signal in a trend chart for displaying length based process values. In FFT displays, frequency ranges can be configured flexibly and be indicated online using markers and highlighted by different colors. Displays can be created fast and intuitively. Any number of display objects can be taken from the "Toolbox" and drawn to the panel using the mouse. Then, they can be configured. All properties of the display objects, such as size, position, alignment, colors, font sizes, scalings etc. are configured in comprehensive dialogs. Measured signals can easily be assigned to the display objects by using drag & drop. Video and other display objects can be positioned and displayed dynamically or switched to an active state. Individual layouts can be created conveniently using defined layout elements.  The function of a paperless recorder is a typical application. ibaQPanel meets numerous requirements, that are typical for recording and visualization of production relevant quality data. The signals run in different trend graphs grouped in a comprehensive manner. The function of a paperless recorder is a typical application. ibaQPanel meets numerous requirements, that are typical for recording and visualization of production relevant quality data. The signals run in different trend graphs grouped in a comprehensive manner.
Due to different colors, they can be easily identified. The graphs can be displayed in a time or length related manner, the chart speed can be selected individually. If required, the signals can be displayed or hidden by a single mouse click. For switching to further views, it only needs a click on the buttons in the header. The buttons can also be assigned to functions like printing or copying into the clipboard. For scrolling back and forth in the display, or zooming a section, the chart speed of the recorder can be stopped. By means of markers, the user can measure single values or sections. In ibaQPanel, data from the ibaHD-Server can be displayed as well. Thus, the user can scroll back over a period of several months or display events. The event table of the ibaHDServer also offers in ibaQPanel its usual functionality, like the event query configurator for targeted finding of events or dynamic display of events as text channel in the trend chart. Thus, information can be filtered rapidly for product number, date or exceeded limit values. Double-clicking on the event opens the trend at the time of the event. The configuration of the display elements and the layout are stored centrally on the ibaPDA server, whereas several clients at different locations can call the ibaQPanel display.  In this example, the ibaQPanel display is integrated as ActiveXControl in a proprietary HMIsystem. In this example, the ibaQPanel display is integrated as ActiveXControl in a proprietary HMIsystem.
Once again, ibaQPanel offers the same functionality, the possibilities of layout and the rapid display as in an ibaPDA client. Using the zoom function, the signals can be displayed with acquisition times as low as 1 ms. In contrast, common HMI systems usually record the signal sequence significantly slower. In our example, a 2D-colored topview chart (outer left) visualizes comprehensively the temperature distribution in a cooling section by assigning different temperature ranges to different colors. With the length-based representation, the user immediately has an overview of the temperature behavior of the strip over the whole length and width. The false color display is especially suited for visualizing profiles, like flatness or deviations in thickness. The bar chart right above visualizes the deviation in temperature from the nominal value. The signal strips show the deviation in thickness in a length-based manner; the measuring location and the nominal value are displayed via a Technostring. By means of buttons, the user can navigate to further views of the HMI system.  On a motor test bench, motors pass through a defined test program. The measured signals are shown in a trend chart with an own scaling along the yaxis each. In the digital meter on the right, the current measured value can be seen additionally as numerical value. On a motor test bench, motors pass through a defined test program. The measured signals are shown in a trend chart with an own scaling along the yaxis each. In the digital meter on the right, the current measured value can be seen additionally as numerical value.
The maximum value reached in the test run can be seen in the chart right beside. In the text entry fields at the top right, test numbers, information on the motors or other comments can be entered as text. The text is written on a virtual input signal or a Technostring section and can be used later for reports. ibaQPanel also offers the possibility to pre-define texts in a selection list and to choose them using a drop down menu. The test program can be started and stopped by means of buttons. ibaQPanel offers pre-defined actions for buttons, like switching the view, interrupting and continuing of trend graphs. Moreover, command lines can be executed and programs be started. With just a few elements, the user can capture all important information and perform the test runs efficiently.  In paper industries, weight and water content are important quality characteristics. In paper industries, weight and water content are important quality characteristics.
In the bar charts, the deviations of the weight (top) and humidity (bottom) from the nominal values are shown in a cross-section profile. A change in color clearly indicates when the limit value is undercut or exceeded. Depending on the required exactitude, one chart may have up to 1000 bars. Alignment, positioning and scaling of the axes, as well as coloring and update time can be configured individually. The limits in the bar chart can be entered directly or defined by a signal.  If parts of a plant are being monitored using ibaCaptureCAM, the views of multiple cameras can be displayed in ibaQPanel. If parts of a plant are being monitored using ibaCaptureCAM, the views of multiple cameras can be displayed in ibaQPanel.
The user can arrange the camera views according to his needs. In addition to the live display, the playback function offers the possibility to rewind along the time axis, to change the playback speed or zoom in certain screen areas. By means of the Scenario Player, the user can switch by triggering to a certain camera view. For example, the cameras of a certain area in the plant can be switched in, when an emergency stop has been caused there. The operating personnel immediately gets insight in the area at risk. Not only the live picture is displayed, but also the image display can be started with a time fore run in relation to to the triggering event in order to detect the cause that triggered the emergency stop. The link to the measured signals offers more insight in that issue.  Pictures and Graphics Pictures and Graphics
Pictures and graphics can be loaded statically, dynamically or triggered. This way, whole plants, flow diagrams or site plans can be visualized, movements simulated or optical warning messages sent when reaching a certain condition. Text Labels Instead of pictures, also texts can be loaded statically or dynamically in text fields and be positioned freely. Using text labels, signal values, Technostring information or other status messages can be displayed. The text can be configured freely, regarding color, font and size. Offline Trend Graph The Offline trend graph offers the possibility to compare completed measurements to the current display. From measured value or text files, time and length based signals can be displayed simultaneously to the current recording. All information fields contained in the measured data file are loaded, including the signal tree. Moreover, data in the offline display can be loaded automatically or triggered, e.g. whenever a measured data file has been completed.  Multi Chart Multi Chart
The Multi chart display object offers the highest possible flexibility of visualization. The signal can be represented as graph, line or by points. Colors and transparencies can be chosen freely; additionally dynamic color ranges can be defined. Also the cursor can be defined freely concerning color, size and symbol. Moreover, an xyrepresentation allows for a display similar to that of an oscilloscope. |


